prints, drawings, paintings, web development, blog posts, link to etsy shop
Geeking Out: Obligatory Map and Stats from my SAKW

I've gone into data analysis mode today. Because that's what I do. I downloaded the data points from my Garmin and plotted them in Excel. Because that's what I do.
First... here's the map that I uploaded to Google Maps.. so you can see the actual route Nancy and I took around the Island of Key West on Saturday, June 24, 2017. It gets funky in the final few miles but I have no explanation for that. Maybe I kept losing the signal when I stopped (my hand could have been underwater).
And below are my Excel charts from the race: my pace charts in both minutes per mile and minutes per 100 yards (which is actually more how I think of pace as a swimmer who trains in a 25 yard pool). Note, the official race results had my averages at 1:22/100 yd, 24.00 min/mile, and 2.50 mph. My Garmin stats had my totals at 2.73 miles swam in 4:59:47 with averages of 1:20 min/100 yd, 23.55 min/mile, and 2.54 mph.
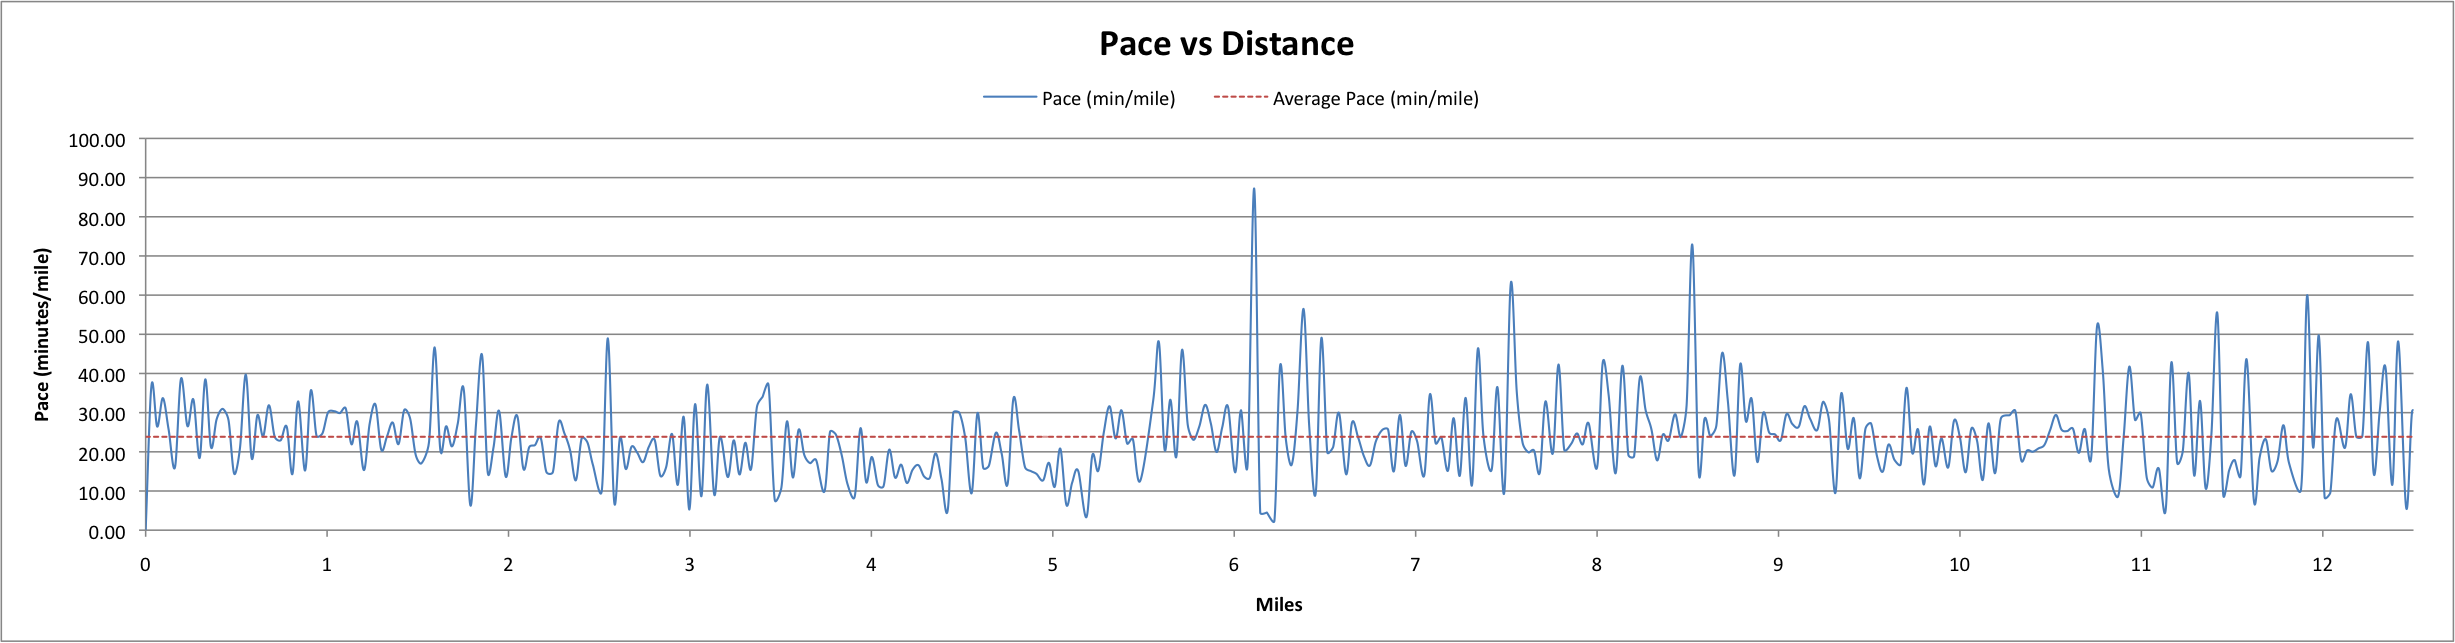
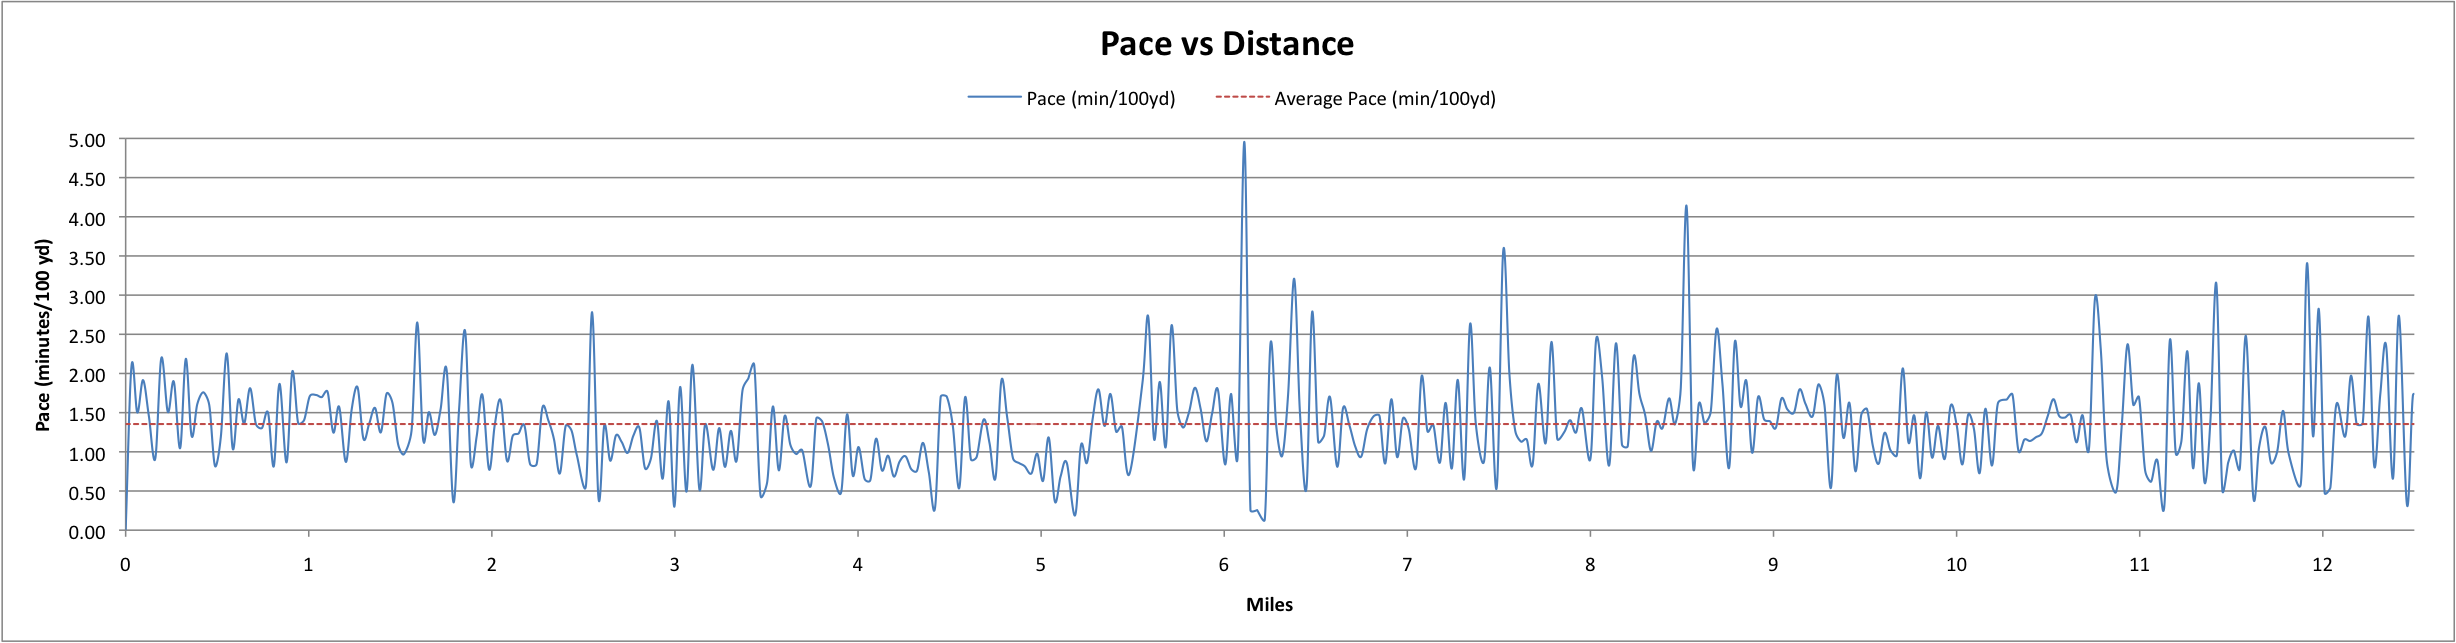
Because I'm a nerd, I proceeded with plotting points on maps and charts to describe my swim around Key West. With Google Map of my specific course and Excel spreadsheet charts of my pace and averages.
friends and sponsors
tags
archive
- May 2021 (1)
- December 2020 (1)
- September 2018 (1)
- September 2017 (2)
- July 2017 (1)
- June 2017 (3)
- May 2017 (1)
- April 2017 (3)
- January 2017 (2)
- November 2016 (1)
- October 2016 (1)
- August 2016 (2)
- July 2016 (5)
- June 2016 (10)
- April 2016 (1)
- March 2016 (1)
- February 2016 (1)
- January 2016 (2)
- December 2015 (1)
- November 2015 (1)
- September 2015 (2)
- June 2015 (1)
- May 2015 (1)
- April 2015 (1)
- March 2015 (2)
- February 2015 (1)
- January 2015 (1)
- December 2014 (1)
- November 2014 (1)
- October 2014 (2)
- September 2014 (2)
- August 2014 (2)
- July 2014 (2)
- June 2014 (1)
- May 2014 (3)
- April 2014 (1)
- March 2014 (1)
- February 2014 (1)
- January 2014 (2)
- November 2013 (3)
- October 2013 (3)
- September 2013 (2)
- August 2013 (2)
- July 2013 (2)
- May 2013 (2)
- March 2013 (2)
- January 2013 (20)
- December 2012 (18)
- November 2012 (28)
- October 2012 (14)
- September 2012 (1)
- August 2012 (2)
- July 2012 (1)
- June 2012 (3)
- May 2012 (2)
- April 2012 (2)
- March 2012 (4)
- February 2012 (2)
- January 2012 (1)
- December 2011 (3)
- November 2011 (3)
- October 2011 (5)
- September 2011 (2)
- August 2011 (3)
- July 2011 (4)
- June 2011 (6)
- May 2011 (5)
- April 2011 (7)
- March 2011 (6)
- February 2011 (5)
- January 2011 (6)
- December 2010 (3)
- November 2010 (4)
- October 2010 (5)
- September 2010 (9)
- August 2010 (5)
- July 2010 (9)
- June 2010 (4)
- May 2010 (4)
- April 2010 (3)
- March 2010 (2)
- February 2010 (4)
- January 2010 (7)
- December 2009 (3)
- November 2009 (1)
- October 2009 (6)
- September 2009 (4)
- August 2009 (6)
- July 2009 (4)
- June 2009 (13)
- May 2009 (7)
- April 2009 (7)
- March 2009 (10)
Add new comment